Expected Golf Scores by Handicap: What You Should Actually Shoot
Last updated: October 9, 2026
Your Handicap Index is not the score you should expect on Saturday. It measures demonstrated potential, built from your better recent rounds, not a typical one. Lee Rainwater, the USGA’s director of handicap education and outreach, told GOLF.com that golfers should expect to play to their number about once in every four to five rounds, and that a normal round lands two to five strokes higher. An older USGA Handicap Research Team finding, summarized on popeofslope.com, is sharper: the average player scores about three strokes above Course Handicap and plays to it or better only about 25 percent of the time.
So on a par 71 where your Course Handicap is 11, the expected score is not 82. It is about 85. That number is what this guide is about. Not a vanity target. A baseline you can take to a real tee sheet or a simulator bay.
Quick Verdict
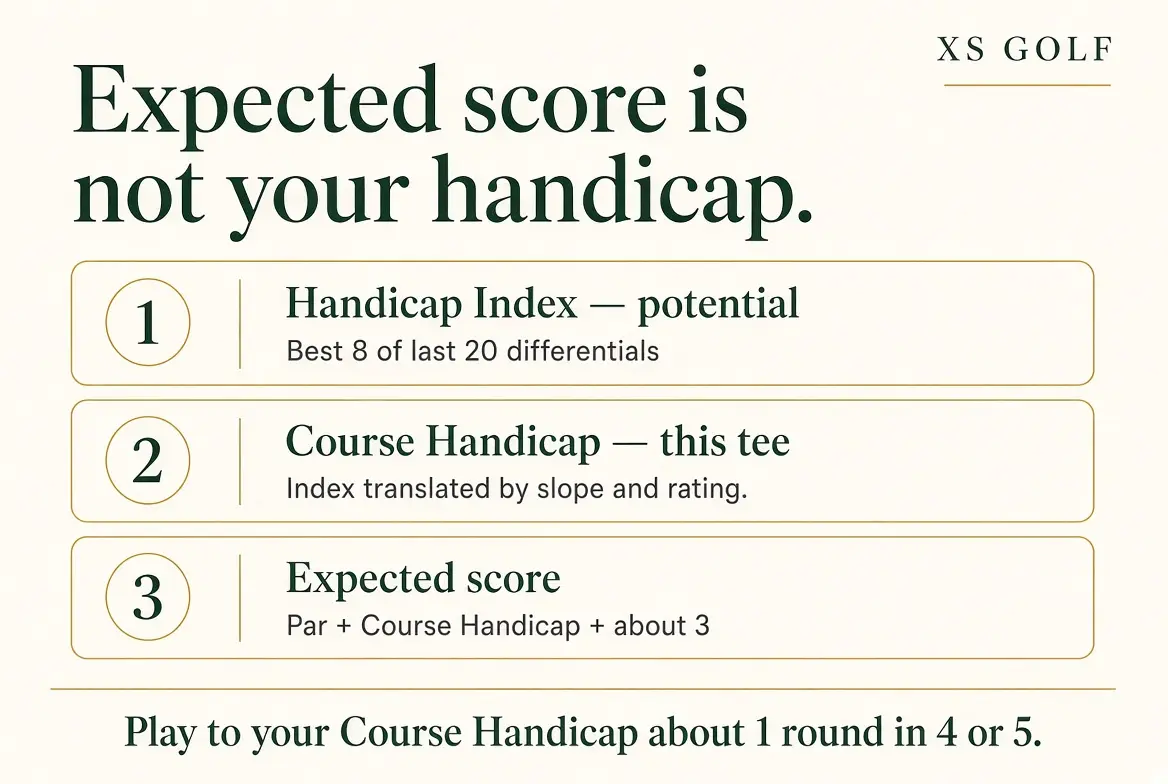
Expected score is roughly par plus Course Handicap plus three
- Handicap Index: your potential, calculated from the best 8 of your last 20 Score Differentials.
- Course Handicap: that Index converted for the tees you are playing, using Slope and Course Rating.
- Play-to-handicap day: par plus Course Handicap. Expect it about one round in four or five.
- Expected score: par plus Course Handicap plus about three, per the USGA Handicap Research Team figures.
- Change the tees and the number moves: a 14.0 Index is about 90 on one par-72 set below and about 95 on a harder one.
These are averages from published USGA and Arccos-based figures, not guarantees for any one round. XS Golf did not collect its own scoring data for this guide.
Three numbers people keep mixing up
Handicap Index. A portable number. Under the World Handicap System it is the average of the best 8 of your most recent 20 Score Differentials. It describes what you have shown you can do, not what you usually do.
Course Handicap. The Index translated onto a specific set of tees:
Course Handicap = Handicap Index × (Slope Rating ÷ 113) + (Course Rating − Par)
Round to the nearest whole number. A Playing Handicap can then apply a competition allowance, but for a casual expected-score estimate, Course Handicap is the input that matters.
Course Rating is the score a scratch golfer is expected to shoot from those tees in normal conditions. It is not par. Two par-72 courses can carry ratings three or four shots apart. Slope Rating measures how much harder the course plays for a bogey golfer than for a scratch golfer, with 113 as the standard. The higher the Slope, the more strokes a mid or high handicapper gets, because the gap between them and scratch widens.
Expected score. What a normal round looks like from those tees:
Expected score ≈ Par + Course Handicap + 3
A day you “play to your handicap” is par plus Course Handicap. That is the good day, not the average day. The same USGA research summary puts a typical player’s best score in 20 rounds only about two strokes better than Course Handicap, which is why the Index sits near the top of your range rather than in the middle of it.
This is a rule of thumb synthesized from named public sources, not an official USGA calculator. It is also not the World Handicap System’s own “expected score”, covered further down, which does a different job.
What that looks like on two sets of tees
Start with an average male golfer. MyGolfSpy’s February 2026 summary of USGA data put the average male Handicap Index at 14.0, with about 23 posted scores a year. The average female Index in the same summary was 28.8, with about 19 posted scores.
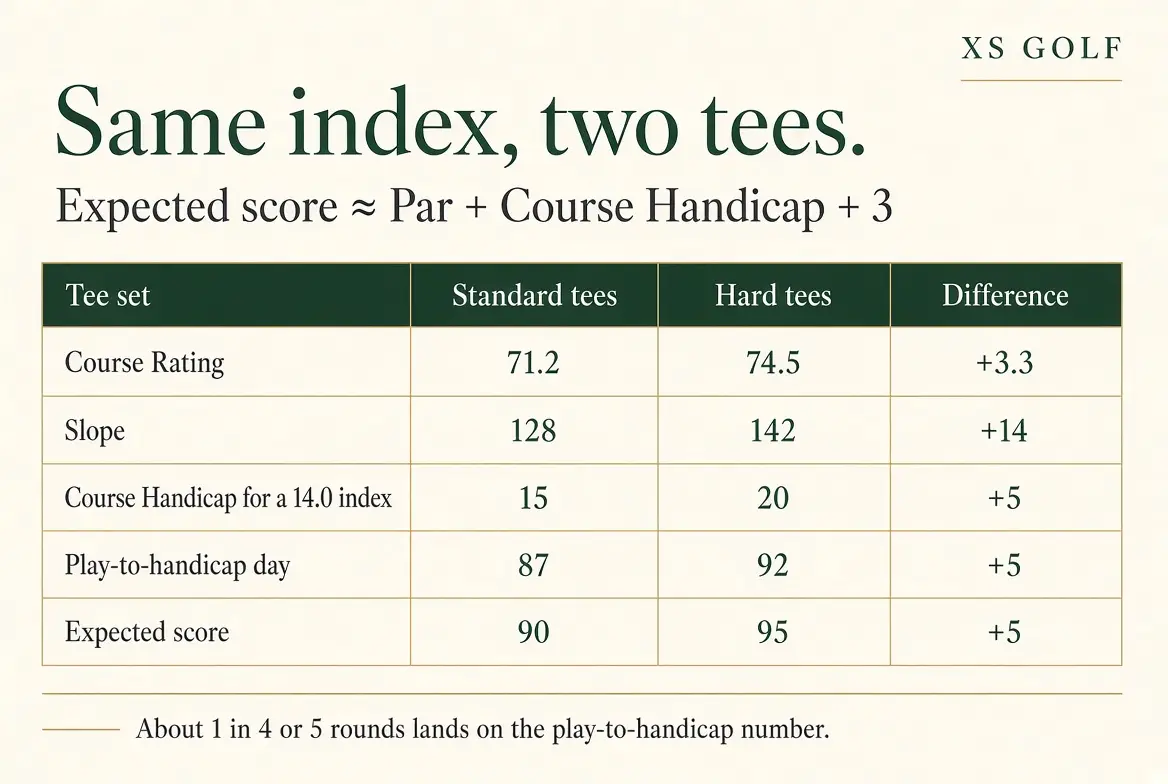
Now two sets of tees, both par 72. The standard set is rated 71.2 with a Slope of 128. The hard set is rated 74.5 with a Slope of 142.
| Handicap Index | Standard tees: Course Handicap | Standard tees: expected score | Hard tees: Course Handicap | Hard tees: expected score |
|---|---|---|---|---|
| 0.0 | +1 | about 74 | 3 | about 78 |
| 5.0 | 5 | about 80 | 9 | about 84 |
| 10.0 | 11 | about 86 | 15 | about 90 |
| 14.0 | 15 | about 90 | 20 | about 95 |
| 18.0 | 20 | about 95 | 25 | about 100 |
| 28.0 | 31 | about 106 | 38 | about 113 |
A 14.0 on the standard tees is looking at about 90, and plays to about 87 roughly a quarter of the time. The same player on the hard tees is looking at about 95. Nothing about the swing changed. The tee sheet did.
Scratch players are not exempt. Lou Stagner, who analyzes Arccos shot data, has said a scratch player on a par 72 rated 71.5 with a Slope of 131 averages about 75 over their last 20 rounds (reported by Golf365). That is close to what the formula gives: par, minus about half a shot for the rating, plus three.
Why the buffer exists
The Index throws out your worse differentials. A 14.0 is not someone who shoots 86 every week on a neutral course. It is someone whose better rounds, after rating and Slope, look like a 14. The other twelve rounds in the window are worse, and they are the majority.
Big numbers on a few holes do most of the damage. Stagner’s Arccos breakdown by hole difficulty, published by GOLF.com, has scratch golfers averaging about 0.35 over par on the hardest hole on the card, and 20-handicaps about 1.58 over. His broader point, in another GOLF.com piece, is that amateurs lower scores by cutting out mistakes rather than by making more birdies. One or two doubles is a normal round, not a collapse. If your expected score has no room for them, it is a target, not an expectation.
The buffer is also why net even feels rare. You are not “off your handicap” because you shot 90 as a 14.0 on the standard tees above. You shot the number the system implies for an average day.
Expected strokes: the same idea, one shot at a time
A round-level expected score answers “what should 18 holes look like?” Expected strokes answers “from this spot, how many shots does it take to hole out?”
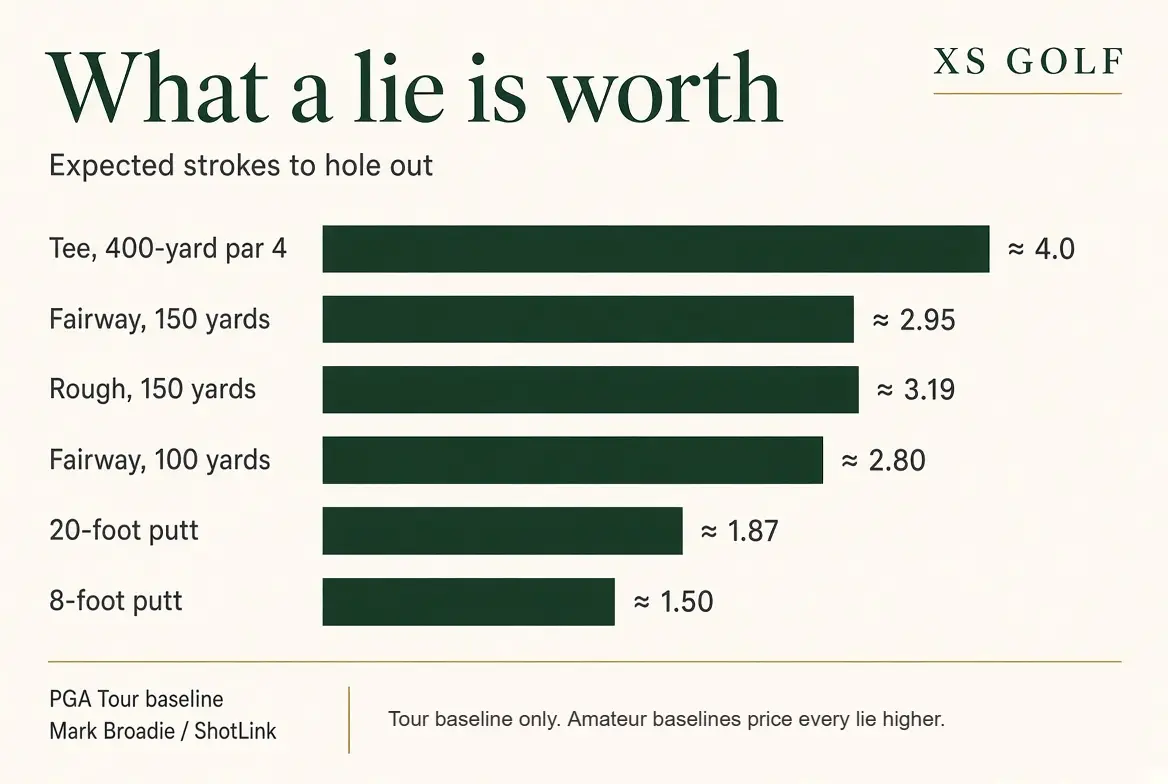
Mark Broadie’s tables, built on PGA Tour ShotLink data and published in his Columbia Business School research and his book Every Shot Counts, are the reference version. A slice of that Tour baseline:
| Position | Expected strokes to hole out (PGA Tour) |
|---|---|
| Tee, 400-yard par 4 | 3.99 |
| Fairway, 150 yards | about 2.95 |
| Rough, 150 yards | about 3.19 |
| Fairway, 100 yards | 2.80 |
| Sand, 30 yards | about 2.66 |
| Green, 20 feet | about 1.85–1.9 |
| Green, 8 feet | 1.50 |
| Green, 3 feet | 1.04 |
Rough versus fairway at 150 yards is about a quarter of a stroke on the Tour baseline. A 20-foot putt is a two-putt more often than not, even for a Tour player. These are prices for a location, not grades for a swing.
The baseline you pick changes the price. Every number above is a Tour number. An amateur baseline prices every one of those spots higher, which is why apps such as Arccos compare you against golfers of a similar handicap rather than against the Tour.
Strokes gained is the difference between two of those prices, minus the shot you spent:
Strokes gained = E(start) − E(end) − 1
Add every shot on a hole and the middle terms cancel. You are left with the baseline’s expected score from the tee minus the score you made. That is why a tracker or a simulator that logs lie and distance tells you more than a scorecard. The 92 is the outcome. The expected-strokes ledger is the reason.
What “expected score” means inside the World Handicap System
The World Handicap System uses the phrase for something narrower. When you post a 9-hole score or a round of 10 to 17 holes, the system fills the unplayed holes with a neutral expected value based on your Handicap Index, so the round can produce a fair 18-hole Score Differential. It does not look at how you played the holes you did finish, and its job is to keep partial rounds from inflating or deflating your Index.
That is a posting tool. It is not a prediction of your back nine, and it is not what this guide calculates. This guide is about the score to expect when you play all 18.
Setting the number before you tee off
Five minutes, on the first tee or in the garage.
- Write down par, Course Rating and Slope for the tees you are actually playing. Not the tips if you are on the whites.
- Compute Course Handicap with the formula above and round to the nearest whole number.
- Write the play-to-handicap number: par plus Course Handicap. That is the good day, the one you should see about a quarter of the time.
- Add three. That is the expected score.
- After the round, note where the extra strokes came from: penalties, three-putts, approach shots that missed the green. That list is where practice pays.
If the card has no rating, as with some simulator courses and temporary tees, do not invent a Slope. Use a neutral Course Rating equal to par and a Slope of 113, and label the result as unadjusted. A hard virtual track with forced carries and fast greens will play harder than that label.
Using it on a simulator
Treat the expected score as a session target only if the software’s course is a fair stand-in for the rating you used. Courses in GSPro, E6 Connect and Awesome Golf vary a lot (our simulator software guide covers the platforms). A forgiving par 72 with wide fairways and receptive greens will beat the formula. A replica of a U.S. Open setup will not. Putting settings such as auto-gimmes change the number too.
Log your score against the formula anyway. After ten rounds on the same virtual course you will have a personal offset, which is more useful than the generic three. If you play a real course’s simulator replica before a trip, as in our guide to playing courses on a simulator before you travel, the offset tells you how far to trust the virtual scores. For structured practice between rounds, the 8-week simulator practice program pairs well with an expected-strokes ledger, and the launch monitors under $1,000 guide compares the units most home setups start with.
What to do with the number
Use the expected score to judge the round, not the Index to judge your mood.
- A 14.0 who shoots 91 on the standard tees above had an ordinary day. A 96 is a bad one. An 87 is the kind of day the Index is built from.
- Do not double your front nine and call it an expectation. The handicap system’s incomplete-round expected score is a posting tool, not a forecast.
- Let the shot-level numbers pick your practice. Broadie’s Columbia research found that shots from beyond 100 yards explain about 72 percent of the scoring difference between PGA Tour players, with putting about 17 percent and the short game about 11 percent. Your own ledger may say something different. Trust the ledger: if it shows strokes leaking inside 50 yards, the short game tips are the place to start; if approaches are the leak, a rangefinder and a fitting check come before another bucket of drivers.
- Recalculate when the tees change. The two sets in the table above are five shots apart for the same 14.0. A lower score from shorter tees is a different course, not improvement.
Frequently asked questions
How often do golfers play to their handicap?
About one round in four or five, according to the USGA’s Lee Rainwater as reported by GOLF.com. An older USGA Handicap Research Team summary puts it at about 25 percent of rounds at or below Course Handicap.
What should a 14 handicap shoot?
It depends on the tees. On a par 72 rated 71.2 with a Slope of 128, a 14.0 Index gets a Course Handicap of 15, so a play-to-handicap day is 87 and a typical round is about 90. On a par 72 rated 74.5 with a Slope of 142, the same player is looking at about 95.
Is Course Rating the same as par?
No. Course Rating is the score a scratch golfer is expected to shoot from those tees in normal conditions. A par-72 course can be rated well above or below 72, and the difference feeds straight into your Course Handicap.
What is “expected score” in the World Handicap System?
It is a neutral value the system uses to fill unplayed holes when you post a 9-hole score or a round of 10 to 17 holes, so the round produces a fair 18-hole Score Differential. It is based on your Handicap Index and is not a prediction of how you will play.
How this guide was put together
XS Golf did not collect scoring data or run any rounds for this guide. It synthesizes published figures: USGA handicap education as reported by GOLF.com, the USGA Handicap Research Team summary on popeofslope.com, MyGolfSpy’s 2026 summary of USGA handicap data, Lou Stagner’s Arccos analysis as reported by GOLF.com and Golf365, and Mark Broadie’s strokes-gained research. The tee comparison uses example ratings, and the Course Handicaps in it were calculated with the published formula. Read more in the XS Golf standards.
Sources: GOLF.com, what your Handicap Index really means · Pope of Slope, how well should you play · MyGolfSpy, how the USGA defines average · Golf365, scratch golfer stats · GOLF.com, hole handicap and score · GOLF.com, lowering your handicap · Broadie, Assessing Golfer Performance (Columbia) · The DIY Golfer, strokes gained
Bottom line
The point of the number is to stop treating a normal round as a failure. Par plus Course Handicap plus three is what the published research says an average day looks like. Beat it and you had a better-than-average day. Match par plus Course Handicap and you had the day your Index is named for. Both are worth writing down. Only one of them should be the number you walk to the first tee expecting.